
If I were invited to talk to a group of students (of any age) today, to explain why everything seems to be hopeless and falling apart, this is what I think I would tell them.
When I was young and idealistic, back in the 1960s — back when your grandparents were your age — everything seemed possible. We’d apparently forced an end to the ghastly war in Vietnam through our massive protests. We were strident environmentalists, really believing we could avert the global ecological disaster many were already predicting.
There were seven things in particular we thought were true and important to fight for, and there seemed to be nearly universal agreement that these goals were both possible and desirable to achieve:
- world peace
- an equitable (re-)distribution of wealth (and power) — enough that everyone could live a comfortable life, and not so much for anyone that it would inevitably lead to waste or abuse
- radical action to halt and reverse ecological destruction — we already knew back then about the risk of catastrophic climate change
- women’s equality, and autonomy over their own bodies
- free, universal, quality health care, education, employment security, old-age security, and public transportation
- enforced regulations to rein in capitalist excesses and oligopolies, and ensure clean, safe communities and workplaces, and
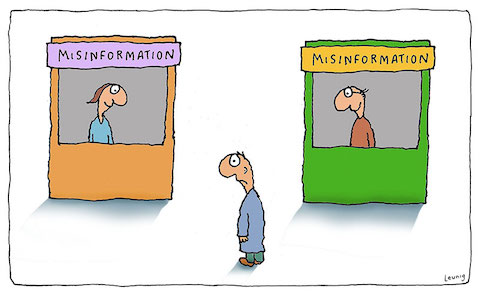
- a truly democratic polity — a system where the citizenry was well-informed, and the political system was democratic and responsive to the citizens’ collective will.
We didn’t believe that any of these goals would be easy to achieve, but in the late 1960s we thought they were possible. In fact, it was generally considered the absolute responsibility of governments to work towards and sustain these seven goals.
In Canada, at the time, we actually had achieved some of these goals, and the governments of the day won elections on the strength of their vows to make even more progress on them. Even the conservative party of the day called itself the Progressive Conservatives.
So what went wrong? Why are we so much further away from achieving and entrenching these perfectly reasonable, popular, worthy, and achievable goals, than we were half a century ago? And why, from all appearances, are we no longer even trying to achieve them, obsessed as we are instead with tax cuts, a loathing of all things related to government and public institutions, and demands for dog-eat-dog individual “rights”? Why, in short, is everything, despite all our efforts, falling apart?
Almost all the answers I have heard to this question assign blame for the failures of these systems and for our abandonment of these goals on someone or other — a greedy elite, or evil corporations, or stupid bureaucrats, or psychopaths in positions of power, or incompetence all around. For much of my life I was inclined to do likewise — it’s a cheap and easy way to explain unexpected and disappointing failures. And accepting the responsibility, the blame, the guilt and shame and sorrow for these failures isn’t something any of us would particularly want to take on ourselves.
But I think there’s another explanation, one that doesn’t require us to identify and blame “bad guys” for these failures, or to shrug and say “we’re all to blame”.
The essence of this explanation is that all systems fall apart, as do all civilizations built on these political, economic, social, educational, health care, transportation, scientific, technological and other systems. Nature recognizes this — nothing in the natural world is built to last, and there is built in resilience and redundancy in all natural systems. As political historian Dmitry Orlov explained in reference to birds’ capacity to adapt and evolve to deal with collapse:
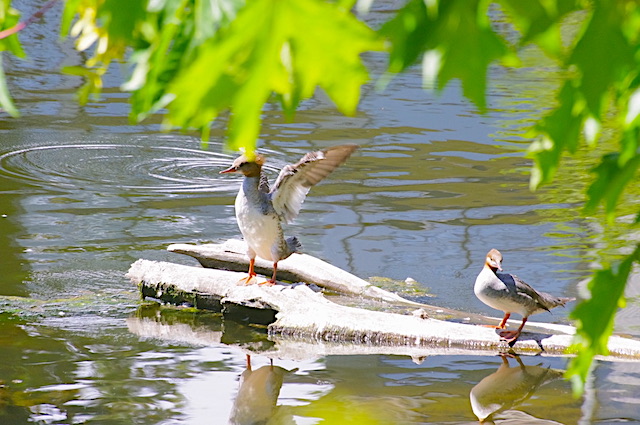
Fifty blackbirds nest in a dead tree, congregating and socializing raucously each evening, the babies squawking for food. Then someone cuts the tree down, and the birds scatter. Collapse. The tree-killer sells the wood and the empty nests for profit. The birds circle and regroup, and in a few hours find a new tree and start building new nests. Three days later, for the birds, it is exactly as it was before the fall. They understand community, and resilience.
We built our complicated human systems as best we could. But we don’t have nature’s billions of years of experience. What we build is inherently fragile, needing constant attention and repair. We try to make things to last, when nothing lasts. And the larger and more complicated our systems become, the more ways there are for them to fail, and to fall apart.
Everything we build is of necessity temporary — it has to keep growing larger and more complicated and be constantly repaired or else it falls apart. Much of the world’s infrastructure is now dated, aging, and falling apart, because we could only afford to build everything we’ve built by cutting corners and planning for their obsolescence — their collapse — and then rebuilding them.
But now, as we have used up the planet’s cheap resources and are digging deeper into its increasingly expensive ones, we can no longer afford to repair what we built. Our only hope now is to abandon and throw away the stuff that’s falling apart, and build more and more, newer and newer, faster and faster, to replace it. Our entire military-industrial-financial-capital economy is based on this idea of perpetual accelerating growth, planned obsolescence, and rapid replacement, and it’s an absurd idea. So now everything is falling apart much faster than we can possibly hope to replace or repair it. This is how collapse happens. We’re seeing it everywhere.
That’s the materialistic answer to the question, but there’s also another, complementary answer, and that has to do with our species’ conditioning.
There is increasing scientific evidence that, just like every other creature on the planet, what we each believe and do is entirely the result of our biological conditioning (what our DNA and our body chemistry ‘tells’ us to do), and our cultural conditioning (what the people we know, the things we study, our environment and our experiences ‘tell’ us to do), given the always-unpredictable circumstances of each moment. When you yell at someone for cutting you off in traffic, that’s not ‘your’ decision; it’s just your conditioning playing itself out. Your conditioning will change as you’re exposed to new information and experiences, but ‘you’ aren’t changing it.
That might sound hopeless, but it really isn’t. As our conditioning to new information and experiences has changed us, we’ve come to believe, for example, that being gay is biological, not a mental illness. We’ve learned that diseases that we once thought were the result of poor parenting, or “evil spirits”, have natural causes, and their sufferers and families deserve our support, not our condemnation.
When you come to realize that our situations, our beliefs and behaviours are the result of our conditioning, and not something we have any free will or control over, it makes you inclined to try to understand what underlies actions that we dislike — like violence and war and dishonesty and selfishness — instead of seeking to blame someone or something for those actions.
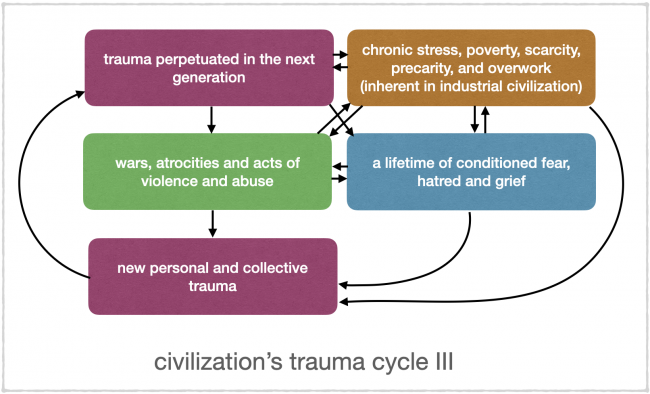
In many cases, what underlies these actions are deep-seated feelings of anger, hatred, grief, and especially fear, that metastasize in us as trauma, just waiting to be stirred up and triggered in us by some event that actually has nothing to do with the long-ago event that conditioned us to react the way we do — the way we have no choice but to react. In some cases that trauma is even passed down from generation to generation in our DNA and in the body chemistry we inherit from our parents.
So when we look at wars, at murders, at domestic abuse, at animal abuse, at racism, at bullying, at lying, at oppression, at misogyny, or at any other form of violence or hatred, we can, if we look hard enough, understand it as a conditioned behaviour, something the perpetrators and participants had absolutely no control over. That doesn’t mean we condone that behaviour; it just means we recognize that, given the conditioning of those involved, that outcome was explainable and, sadly, inevitable.
So what do we do with that? Just throw up our hands and say that such atrocities are just ‘the way we are’ and we just have to accept them? Well actually, understanding the conditioning that led to them is a very important action in itself. That understanding can lead us to avoid escalating the situation, and to starting to address the factors that led to that misbehaviour or atrocity, so that, perhaps, we can begin to condition each other to mitigate or even prevent such misbehaviours and atrocities in the future. Blaming people, calling them evil or malicious or insane, will not change anything, other than perhaps leading to even more misbehaviours and atrocities in self-justified retaliation. But if we have been conditioned to blame, rather than to try to understand, we will blame.
So, this is why everything is falling apart, when no one is actually to blame. In part, it’s because everything humans make falls apart, everything collapses when it is no longer sustainable, when it gets too big or too old or too complicated to hold. And in part, it’s because everything we do is conditioned behaviour, often irrational behaviour, and that behaviour, over which we have no control, is often destructive and contributes to everything falling apart, despite us all doing our best and having the best intentions in what we do.
And there is a third reason why everything is falling apart, and it is also blameless.
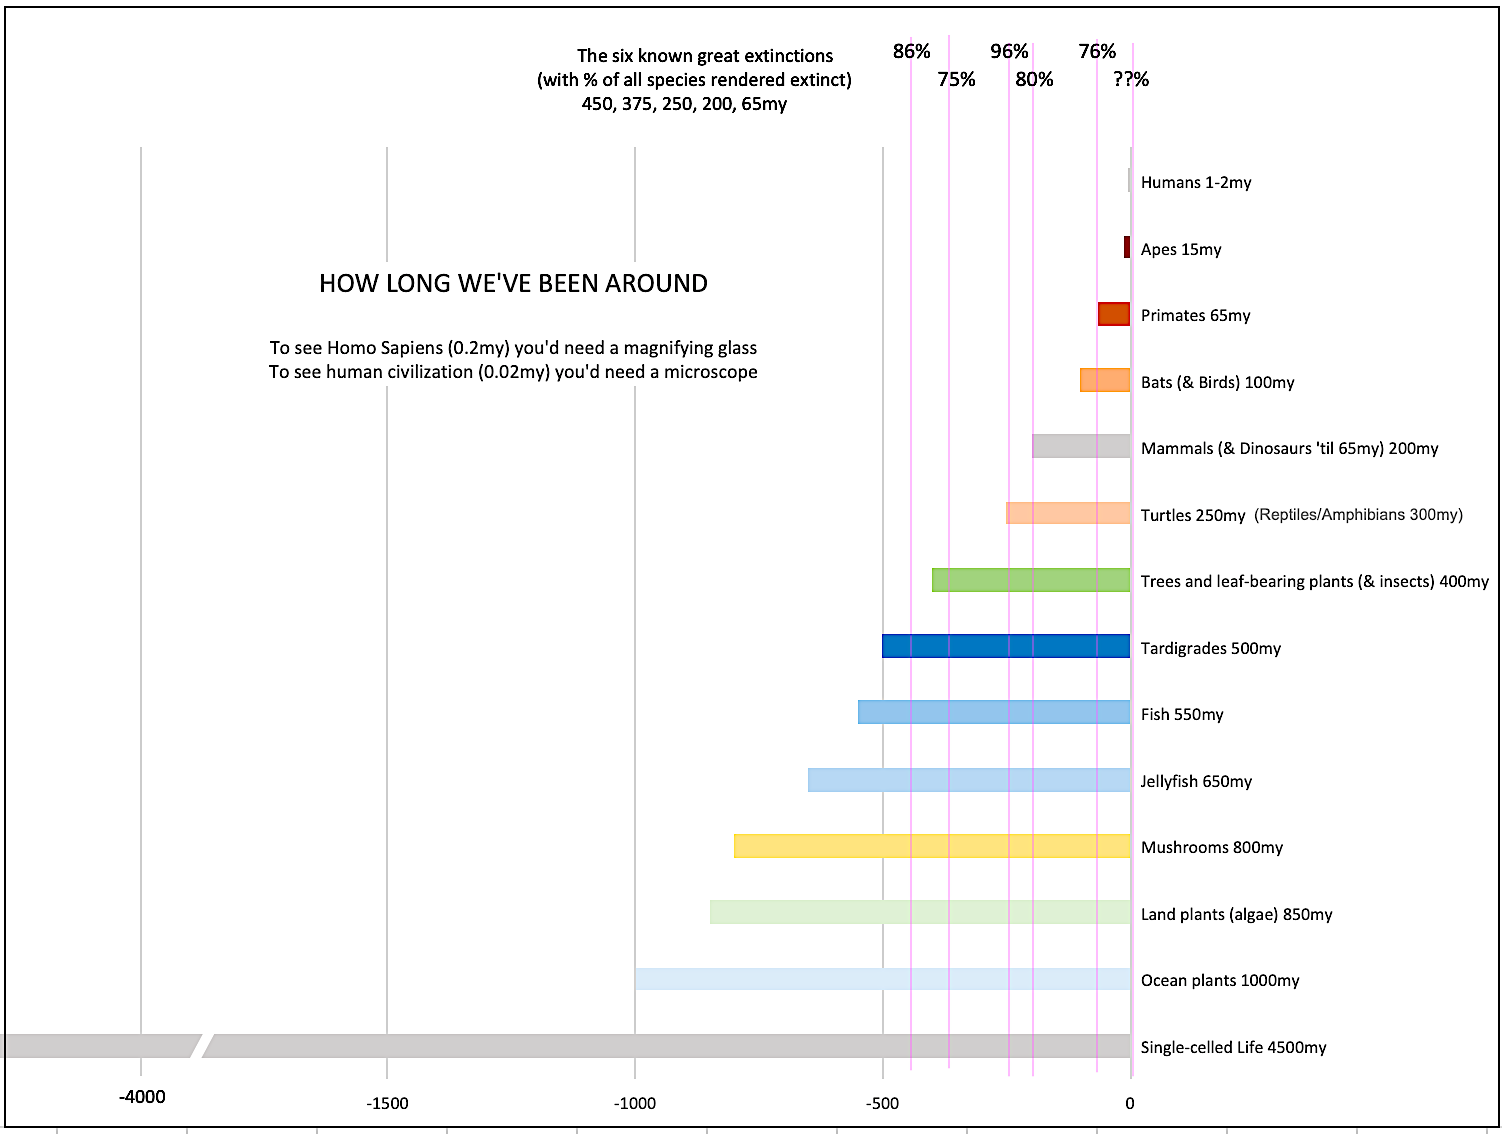
The human species evolved to be a social species. We don’t have the speed, or the fangs, or the claws, or the agility, or the climate tolerance, to be able to survive well on our own. We thrive in community. We do things together, drawing on our collective energy, our collective skill and knowledge, much better than we can ever hope to do alone. We evolved abstract language and other tools to enable us to collaborate. And we do that in small communities, the way we thrived for our first million years on the planet.
The problem is, the benefits of community don’t scale well. We work best in groups of 2-10, and in limited situations in groups of up to 50. Anything beyond that starts to become unmanageable, because our tribes are based on collective knowledge of, and mutual trust in, each other. I have seen how well this works, in a small village in Central America where they have no ‘centralized’ services. They resolve disputes, heal illnesses, build and repair homes and other infrastructure, together. There are no corporations, no governments, no police, no jails, no lawyers, no written contracts. They need none of these, because they know and trust each other. They just get together and do what needs to be done. They know how to do this.
Once you get a human society that is larger than community-sized in scale, it begins to lose cohesion — It begins to fall apart. You try to replace mutual knowledge and trust with institutions and standards and rules, but it doesn’t work. You end up with disagreements, with inequities, with attempts to exploit others, and with lies, and every attempt to impose more order actually creates more disorder, more things that can go wrong.
Not only have we, in our modern world, tried to make the idea of functional society work “efficiently and effectively” at a scale larger than the level of community, which is impossible, we have largely abandoned the idea of community altogether. Living in true community requires a host of skills — listening, facilitation, negotiating, consensus-building, mentoring, teaching through demonstrating, imagining alternative possibilities, trust-building, self-knowledge, cultural awareness — that most of us are now incompetent at, mostly because our work and school and family lives today do not give us any practice at learning to be good at these things. We don’t even, most of us, know our neighbours. If we were forced, by some catastrophic disaster, to suddenly have to work with them as a true community, we wouldn’t even know where to start. We have lost, or forgotten, all the essential skills.
So, that’s the third reason everything is falling apart. We live in a prosthetic (artificial) world of fragile human-made systems, our behaviour is entirely conditioned, and we have lost the essential capacity to live with each other in true community. The result is what you see in dysfunctional governments, corporations, schools, health care and other institutions, families, neighbourhoods, and nations. The only real surprise is that it all hasn’t fallen apart sooner. And none of it is anyone’s “fault”. We’ve all done our best.
What will it look like as it continues to fall apart? That will depend on where and how you live. If you live in most of the world’s nations, which are failed states with desolated natural environments, or if you live in urban ghettoes, or washed-up small towns, or homeless in the streets in any country, collapse is already well underway. If so, you already live in a world of precarity — complete uncertainty over what each day will bring and whether you’ll eat or be safe today. You trust only those in your makeshift, unequipped, struggling ‘community’. You expect nothing from any institution. Your life is probably ruled by fear, by anger, by grief, by shame, by a feeling of helplessness and hopelessness. You are probably deeply traumatized.
If you are more privileged, collapse will likely continue to happen slowly, almost imperceptibly, and then things will happen quickly all at once — loss of jobs and livelihood, serious disease or mental collapse, currency collapse, so your savings are gone and your money no longer ‘works’. And then more stability for a while. And then another bout of collapses — the city goes bankrupt, the government is overthrown or just ceases to function, the hospitals and schools close, the power goes off and stays off, the roads are closed because they’re dangerous to drive on. And so on. And at each stage, you will, of necessity, learn how to do more things for yourself, collaboratively with the community in which you find yourself, including the neighbours you never knew, and the ones you don’t particularly like. You will learn to do more with less, and rely more on your community and less on everyone and everything else.
And you will probably have to migrate at some point to some more sustainable, less dangerous, less ruined place. You might migrate many times over long distances, each time of necessity finding a new community or bringing along the one you’ve helped create.
This might sound awful, but it mostly, probably, won’t be. It won’t be like a Mad Max movie. Collapse will be slow and punctuated by quieter times; we will have time to learn the things we have to learn to adapt to the new, more local, simpler world.
I can’t tell you not to be afraid, or angry, or sad, about the inevitability of collapse. After all, those are all conditioned behaviours, and you will feel, and do, what you will, as a result of that conditioning. I can tell you that there will be no going back to the complex, extravagant, global civilization you’ve become accustomed to. The inexpensive energy and resources necessary for its construction will no longer be available. They are already on life support, and extracting and using them is ruining our environment in the process.
And if the experts on civilizations are correct, this collapse will continue for many generations, perhaps even for a millennium or more. By then those future humans (likely a much smaller number of humans, in the millions rather than billions) will have re-learned, over centuries, how to live in self-sufficient community, the way pre-civilization communities did. They may, of necessity, have learned to live as a part of the natural world, with its inherent uncertainty, and accept, with equanimity rather than fear, the risks of living as a part of the more-than-human world. They may be reconnected with the Earth and all its life in ways we can no longer even imagine, and feel a constant sense of joy and astonishment to be part of that.
Their necessary community self-sufficiency will give them a sense of confidence in their capacity to deal with any issues that arise, that our atomized, dependent civilization has never been able to give us. My sense is that we will see our return to the wild as a blessing, as the only sensible way to live. I kind of wish I could transport into the future, past the chaos of collapse, to see what life for post-civilization humans will be like. Perhaps more like the life of the bonobos, or the crows, than like anything in our history books.
If you’ve followed this so far, you probably will know better than to ask what we can or ‘should’ do to prepare for this. Nothing will prepare you for collapse, and nothing I could suggest will ‘change your mind’ anyway — You are going to do whatever your conditioning compels you to do. Some of that conditioned behaviour will be helpful; some of it will not. As I’ve come to accept this, I’ve stopped proffering useless advice on how to prepare for a centuries-long collapse.
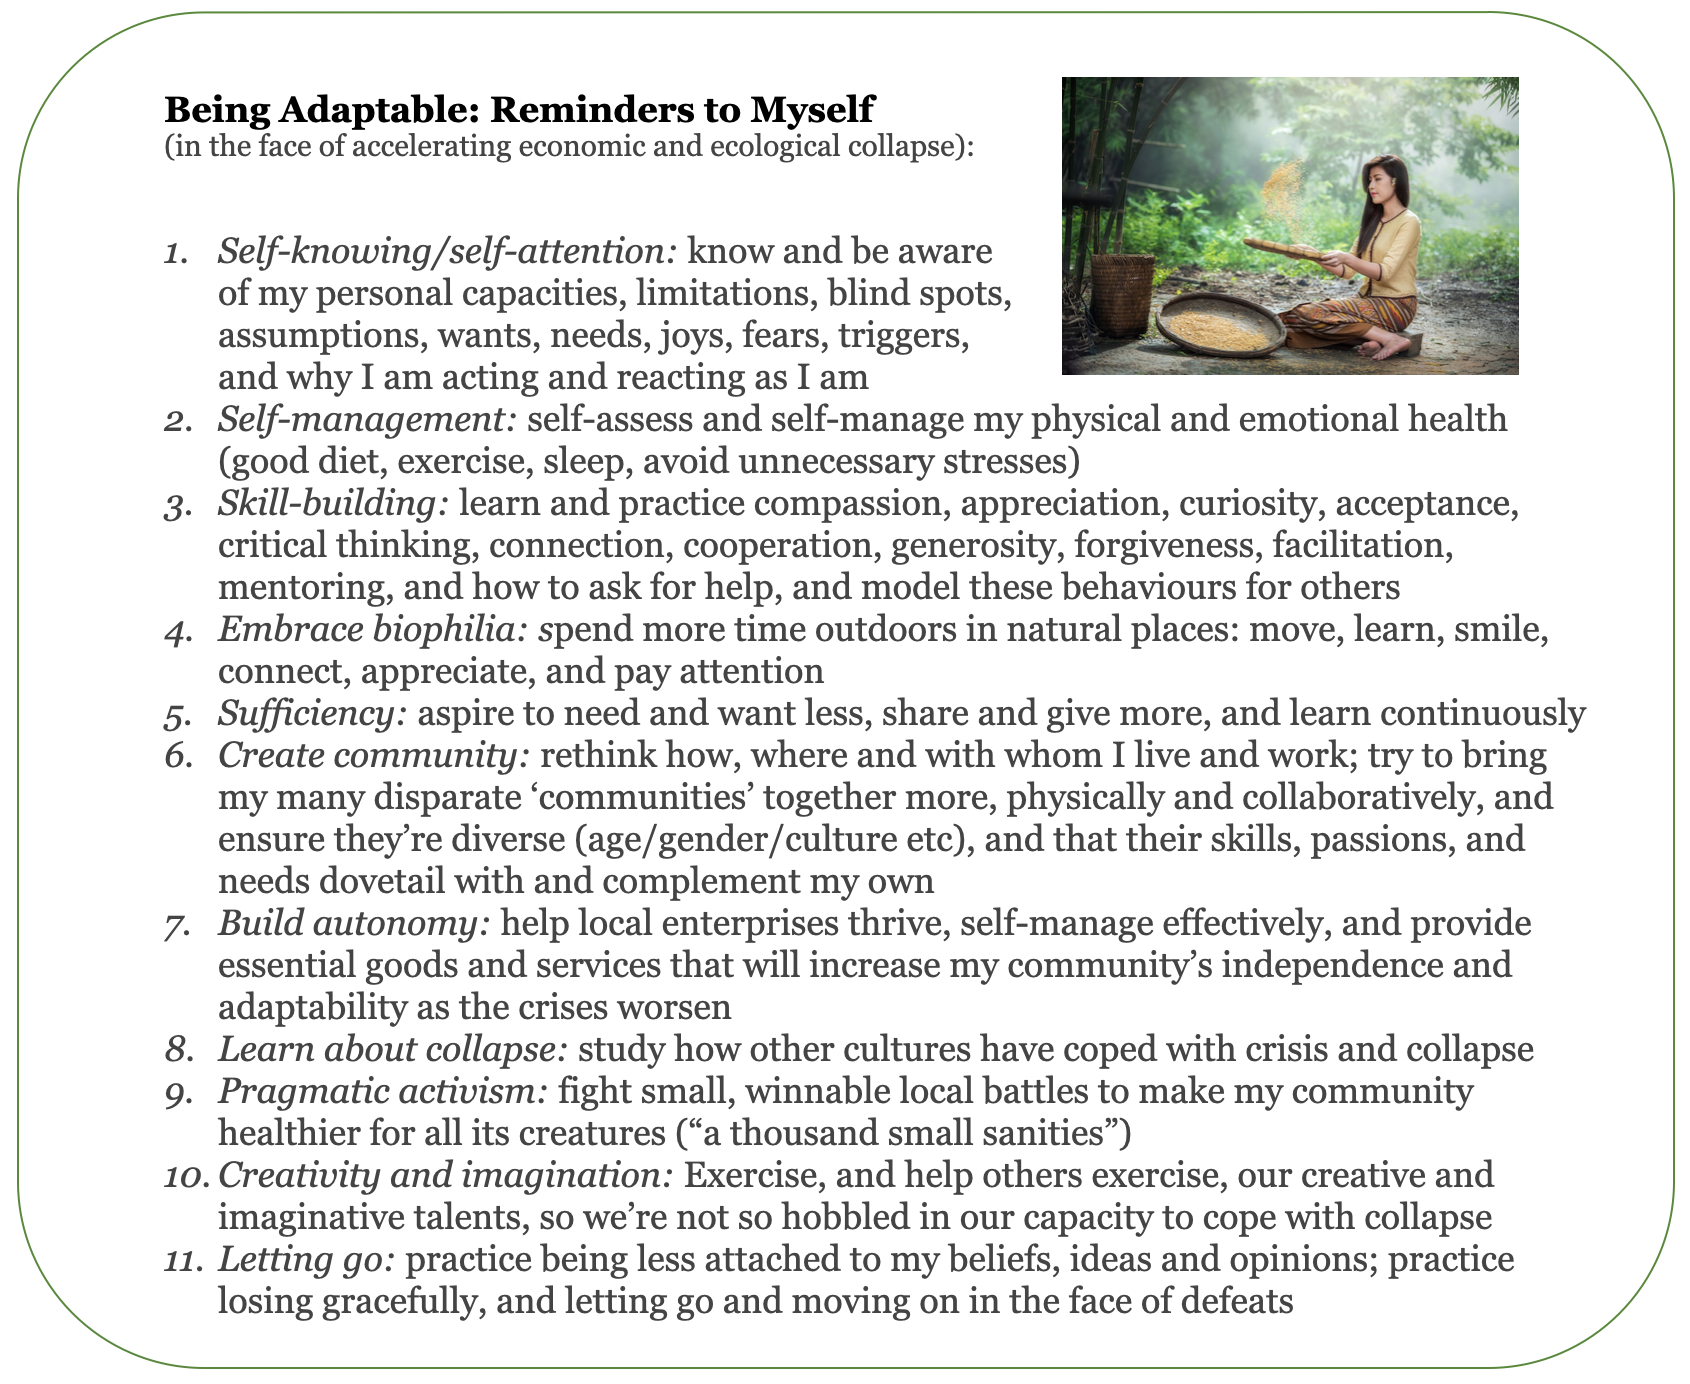
My own coping mechanism is now to just try to make sense of what is happening, to resist the urge to get angry, fearful, disappointed, or full of shame about this strange and excessive experiment we call human civilization. When I feel these feelings arise, I look at my “reminders” list (the list at the top of this post), and try to regain a sense of calm and perspective by appreciating that it all had to turn out just as it turned out, and that there’s nothing ‘wrong’ about what we’ve done.
My conditioning has led me to believe this list of ‘reminders’ is useful, not for telling me what to do, but for helping me to keep what is happening in perspective. I do some of these things reasonably well; some others I do badly, or not at all. Since your conditioning has inevitably been different from mine, this list is unlikely to be useful to you, if it even makes any sense to you at all.
But if you’re ready to accept the inevitability of collapse — that everything is falling apart, and it’s going to get crazy — you might find it helpful to have your own list of reminders, to stay cool and focused in the stormy years ahead. And my guess is that if that list enables you to seek to understand why things are happening and why people are behaving the way they are, instead of blaming people for how they ‘should’ or ‘could’ be, then it just might keep you sane when everyone around you is losing their heads.
If so, that might make you particularly useful to your loved ones and your community as you work together to cope with, and adapt to, collapse. Everything returns to the earth. But on the long roller-coaster ride down, it’s going to be an astonishing journey. May it also be a joyful one, for you and your descendants.


