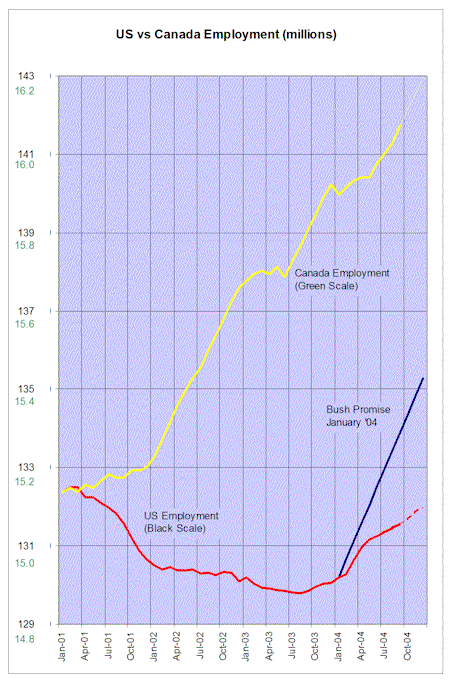
Here are some updates to my dreaded economic charts.  As promised, I’ve been tracking the Bush promise to create millions of new jobs in 2004 (blue line) against the actual pathetic US employment results (red line) since the start of his regime. Last month, employment ‘growth’ was 96,000 jobs, less than 2/3 the increase in the monthly labour force. Bush hence becomes the first president to preside over a net decrease in jobs during his administration since the great depression. For comparison against a fiscally and socially responsible regime, the Canadian employment trends over the same period, shown at 1/9 scale, are superimposed (yellow line). Over the last four years, both Canadian labour force and Canadian employment have risen by about 1 million (7%). What’s more, this entire increase has been in full-time employment (which Canada tracks separately), whereas the US figures are inflated by a disproportionate number of part-time jobs. Before you come up here looking for a job, I should tell you that the employment situation in Canada remains unsatisfactory — far too much of the country’s employment is low-skill work, or dependent on the exploitation of increasingly depleted non-renewable resources, or dependent on a cheap Canadian dollar, making Canadian products artificially inexpensive. The situation for job-seekers in the US, where the situation is much worse, must be absolutely dreadful. Why doesn’t the US unemployment rate (which is nominally still lower than Canada’s) reflect this crisis? Because Americans in staggering numbers are giving up looking, and these discouraged workers are not counted as unemployed. To be counted as unemployed you have to have ‘actively searched’ for work in the past month. |


Regarding “Americans in staggering numbers are giving up looking, and these discouraged workers are not counted as unemployed.”Where will I find supporting data?Thanks.Jim
As a borrower myself (mortgage), I am looking forward to inflation. 10% inflation for the next four years could greatly reduce our debt as a percentage of GNP (or whatever other real earning marker you want to use). Inflation always favors the borrower.
Jim: I presume you’re looking for data that they’re giving up, not data that they’re not counted. The data requires you to read between the lines, since the Bureau of Labor Stats only collects data on what people do (i.e. didn’t actively look in the last 4 weeks) rather than more nebulous, subjective data on why. As this report from Newsday, dated Sept. 6 and now available only in the Google Cache, shows, in addition to the 8 million ‘officially’ unemployed, there are 100 million Americans of working age (16+) not employed full-time, including 25 million working part-time and 75 million not working at all. The key data to track are (a) the declining employment rate (the % of those of working age working full-time or part-time), (b) the rising proportion of those working employed involuntarily in temporary or part-time work, (c) the declining participation rate (the % of those of working age who are either working or ‘actively looking for work’, (d) the rising average length of joblessness, which suggests that people aren’t giving up looking without a fight. You can find all this data at the BLS site (bls.gov), and a whole series of analyses describing the evidence that more and more people are giving up looking for work at the EPI site (jobwatch.org and epinet.org). There are currently 225 million Americans of working age, growing at 1.2% (2.7 million) per year (220,000 per month). At the usual 2/3 participation rate, that means 150,000 people per month are being added to the numbers looking for work. Over a 4-year term that amounts to 7.2 million additional people seeking work. In the last four years employment has actually dropped by 0.8 million, meaning that, barring dropouts, unemployment would have risen by 8 million, i.e. doubled. The ‘actual’ reported unemployment rate is largely unchanged at 5.4%. That means that in four years, a net of 8 million people, equivalent to the total number of unemployed, have simply given up looking for work. And since much of the employment gains in recent months has been temporary and part-time work, the number who have given up looking for full-time work is probably several millions higher still. Hope that’s enough data to get you going.
Derek: Absolutely. But the debtor’s edge is temporary, since when the mortgage comes up for renewal the double-digit rate will kick in. Inflation favours the borrower when it is substantial compared to the rate of borrowing.
On inflation and borrowing: a lot of mortgages in the US today are adjustable rate, which both reduces the borrower’s advantage and creates a time bomb. Many home buyers have used the low initial rate of ARMS, and lenders’ willingness to finance with very little down payment (even 0%!), in order to get into homes they otherwise couldn’t have afforded. When the interest rates go up, many will be faced with increased payments they can’t meet, and lacking sufficient equity to pay selling costs, they’ll have to come up with more money on the way out. Since there’s a lot of these folks, you can imagine the impact on the economy.There’s recent book on this: Elizabeth Warren’s “
Sorry about the fingerfehler. The book is called “The Two-Income Trap: Why Middle-Class Mothers & Fathers are Going Broke”. You can read the short version in an interview with David Brancaccio at http://www.pbs.org/now/transcript/transcript326_full.html#warren.