
 On a couple of occasions, I’ve tried to explain the vulnerability and unsustainability of our over-leveraged, debt-dependent, consumption-dependent economy.While Jon Husband was visiting with me today, he talked about the power of visualizations, and I decided it might be easier to explain this with a chart. Ideally, we need an EcoLanguage animated chart for this, but tell me what you think of the cash flow chart above for now. Here’s its explanation: The economy depends fundamentally on the ‘consumer’ activities of taxpayers, and specifically on the willingness and ability of taxpayers to spend their money on real estate (flow 1), taxes and user fees (2), and the purchase of (now mostly overpriced, imported) products (3). The spending on real estate (1) drives up real estate prices, providing increased collateral to consumer lenders (4), allowing these lenders to loan ever-more money to taxpayers (5). This creates a self-perpetuating Real Estate Cycle (flows 1, 4, 5) that produces the Two Income Trap. The taxes and user fees paid by ordinary taxpayers (2) fund large tax cuts to rich taxpayers (6) which are rewarded by campaign contributions to ‘friendly’ politicians (7), so that a Campaign Funding Cycle (flows 2, 6, 7) is created. The government also rewards these campaign contributions (7) by giving large subsidies to major corporations (8) to enable them to globalize and crush smaller competitors (9), which drives up the share values of these large oligoplies (10), which in turn produces huge profits for the oligopolies and their rich taxpayers (11). The result is a Corporate Subsidy Cycle (flows 7, 8) and an Oligopoly Creation Cycles (flows 9, 10, 11). The oligopolies invest some of their profits (a decreasing amount) in wages to domestic workers (12) to keep these cycles from running out of steam. They also invest come of these profits in financial organizations and instruments (13), and use some of the rest (an increasing amount) to make wholesale purchases of cheap imported products (14). These purchases are financed by foreign loans from the grateful struggling nation producers (15), producing an Offshoring and Trade Deficit Cycle (flows 14, 15, 8). As taxpayers are forced (because of shrinking real wages and the elimination of domestic alternative suppliers — the Wal-Mart Dilemma) to buy the (mostly overpriced, imported) products of the oligopolies, they complete both the Price-Gouging Cycle (flows 12, 3) and the Consumer Deficit Cycle (flows 3, 13, 5). These seven self-reinforcing ‘vicious cycles’ have led to our current economic crisis, characterized by:
The problem with these cycles is that the taxpayer outflows (flows 1, 2, and 3) are all expenses — none of them get repaid, while the taxpayer inflows are either decreasing in real terms (12) or repayable with interest (5). This means that the taxpayers are consistently spending beyond their means and getting further and further into debt. It’s a cycle of addiction. What happens when the credit crunch comes — taxpayers have borrowed their limit and just can’t spend any more? What happens when the heavy trade deficit causes a spike in interest rates , making debts unrepayable (other than record rates of bankruptcy)? What happens when the real estate bubble bursts? The answer is that flows (1), (2) and (3) suddenly dry up, and then all the flows that depend on them (flows 4 through 15) also dry up, or even reverse direction, exacerbating the problems. The negative flows are self-reinforcing just as the positive ones are. It’s called an economic depression. How do you break these cycles of addiction? Each one has its own solution, none of them popular, all of them difficult:
You now know more more about the economy than some so-called economists. There are quite a few that will tell you that all these cycles are’self-correcting’ and that more deregulation is all that is needed. |
Navigation
Collapsniks
Albert Bates (US)
Andrew Nikiforuk (CA)
Brutus (US)
Carolyn Baker (US)*
Catherine Ingram (US)
Chris Hedges (US)
Dahr Jamail (US)
Dean Spillane-Walker (US)*
Derrick Jensen (US)
Dougald & Paul (IE/SE)*
Erik Michaels (US)
Gail Tverberg (US)
Guy McPherson (US)
Honest Sorcerer
Janaia & Robin (US)*
Jem Bendell (UK)
Mari Werner
Michael Dowd (US)*
Nate Hagens (US)
Paul Heft (US)*
Post Carbon Inst. (US)
Resilience (US)
Richard Heinberg (US)
Robert Jensen (US)
Roy Scranton (US)
Sam Mitchell (US)
Tim Morgan (UK)
Tim Watkins (UK)
Umair Haque (UK)
William Rees (CA)
XrayMike (AU)
Radical Non-Duality
Tony Parsons
Jim Newman
Tim Cliss
Andreas Müller
Kenneth Madden
Emerson Lim
Nancy Neithercut
Rosemarijn Roes
Frank McCaughey
Clare Cherikoff
Ere Parek, Izzy Cloke, Zabi AmaniEssential Reading
Archive by Category
My Bio, Contact Info, Signature Posts
About the Author (2023)
My Circles
E-mail me
--- My Best 200 Posts, 2003-22 by category, from newest to oldest ---
Collapse Watch:
Hope — On the Balance of Probabilities
The Caste War for the Dregs
Recuperation, Accommodation, Resilience
How Do We Teach the Critical Skills
Collapse Not Apocalypse
Effective Activism
'Making Sense of the World' Reading List
Notes From the Rising Dark
What is Exponential Decay
Collapse: Slowly Then Suddenly
Slouching Towards Bethlehem
Making Sense of Who We Are
What Would Net-Zero Emissions Look Like?
Post Collapse with Michael Dowd (video)
Why Economic Collapse Will Precede Climate Collapse
Being Adaptable: A Reminder List
A Culture of Fear
What Will It Take?
A Future Without Us
Dean Walker Interview (video)
The Mushroom at the End of the World
What Would It Take To Live Sustainably?
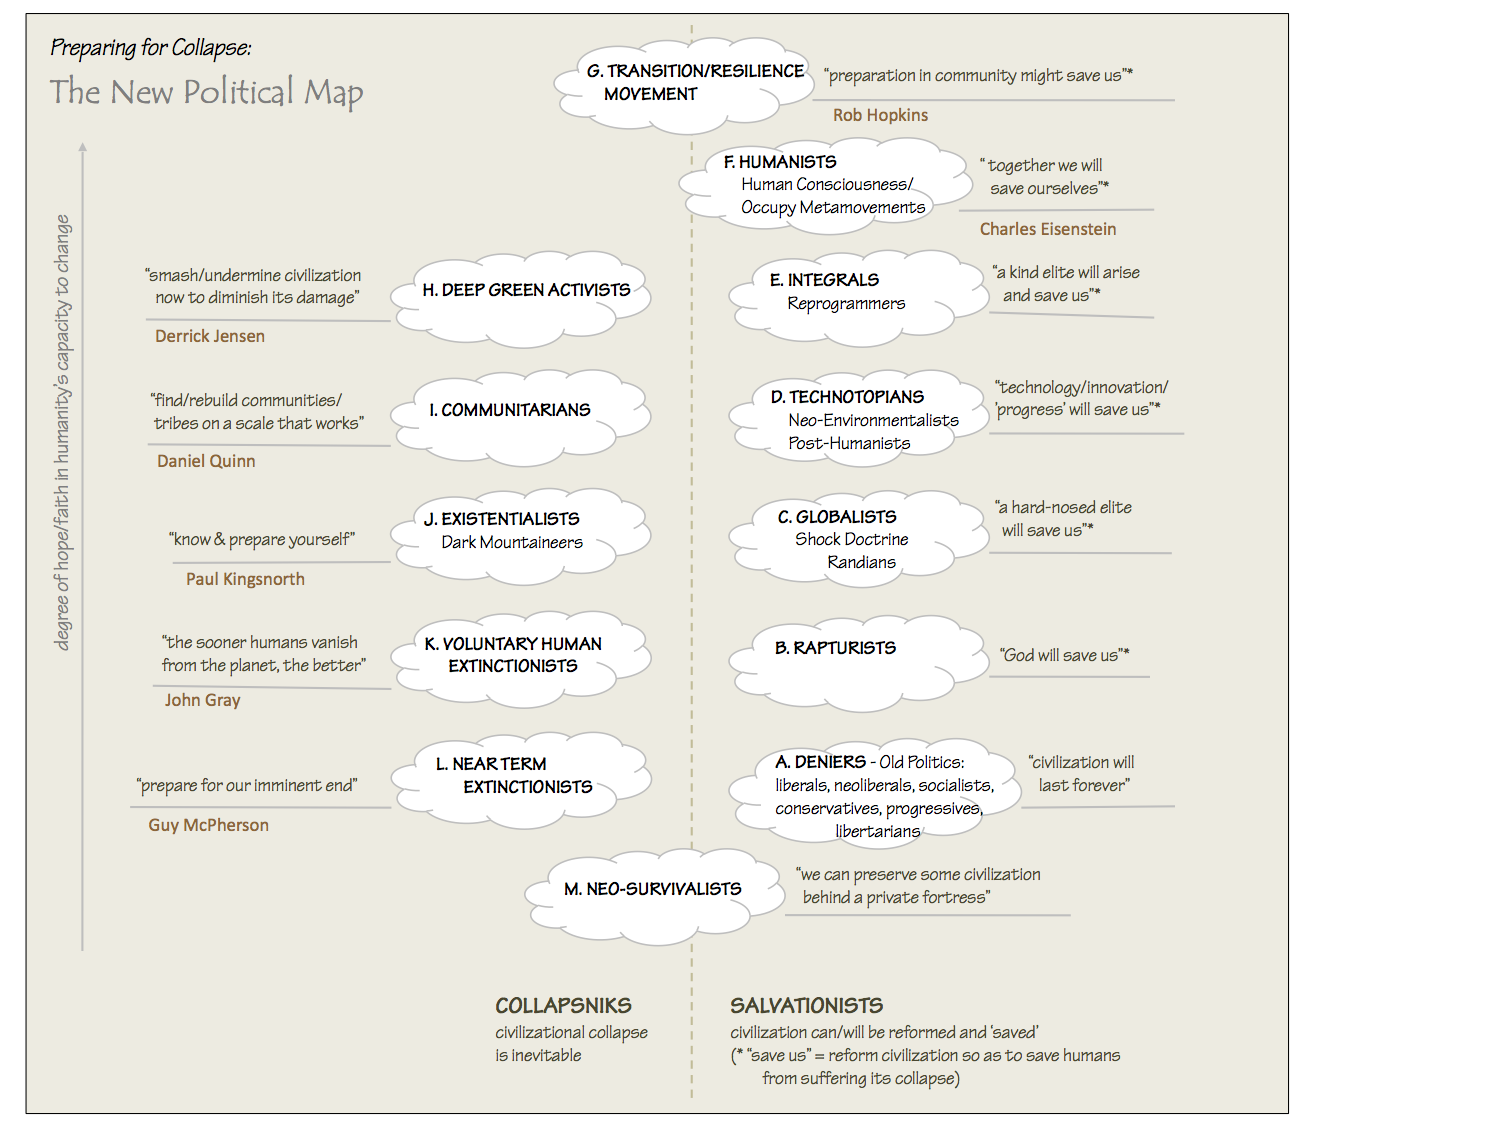
The New Political Map (Poster)
Beyond Belief
Complexity and Collapse
Requiem for a Species
Civilization Disease
What a Desolated Earth Looks Like
If We Had a Better Story...
Giving Up on Environmentalism
The Hard Part is Finding People Who Care
Going Vegan
The Dark & Gathering Sameness of the World
The End of Philosophy
A Short History of Progress
The Boiling Frog
Our Culture / Ourselves:
A CoVid-19 Recap
What It Means to be Human
A Culture Built on Wrong Models
Understanding Conservatives
Our Unique Capacity for Hatred
Not Meant to Govern Each Other
The Humanist Trap
Credulous
Amazing What People Get Used To
My Reluctant Misanthropy
The Dawn of Everything
Species Shame
Why Misinformation Doesn't Work
The Lab-Leak Hypothesis
The Right to Die
CoVid-19: Go for Zero
Pollard's Laws
On Caste
The Process of Self-Organization
The Tragic Spread of Misinformation
A Better Way to Work
The Needs of the Moment
Ask Yourself This
What to Believe Now?
Rogue Primate
Conversation & Silence
The Language of Our Eyes
True Story
May I Ask a Question?
Cultural Acedia: When We Can No Longer Care
Useless Advice
Several Short Sentences About Learning
Why I Don't Want to Hear Your Story
A Harvest of Myths
The Qualities of a Great Story
The Trouble With Stories
A Model of Identity & Community
Not Ready to Do What's Needed
A Culture of Dependence
So What's Next
Ten Things to Do When You're Feeling Hopeless
No Use to the World Broken
Living in Another World
Does Language Restrict What We Can Think?
The Value of Conversation Manifesto Nobody Knows Anything
If I Only Had 37 Days
The Only Life We Know
A Long Way Down
No Noble Savages
Figments of Reality
Too Far Ahead
Learning From Nature
The Rogue Animal
How the World Really Works:
Making Sense of Scents
An Age of Wonder
The Truth About Ukraine
Navigating Complexity
The Supply Chain Problem
The Promise of Dialogue
Too Dumb to Take Care of Ourselves
Extinction Capitalism
Homeless
Republicans Slide Into Fascism
All the Things I Was Wrong About
Several Short Sentences About Sharks
How Change Happens
What's the Best Possible Outcome?
The Perpetual Growth Machine
We Make Zero
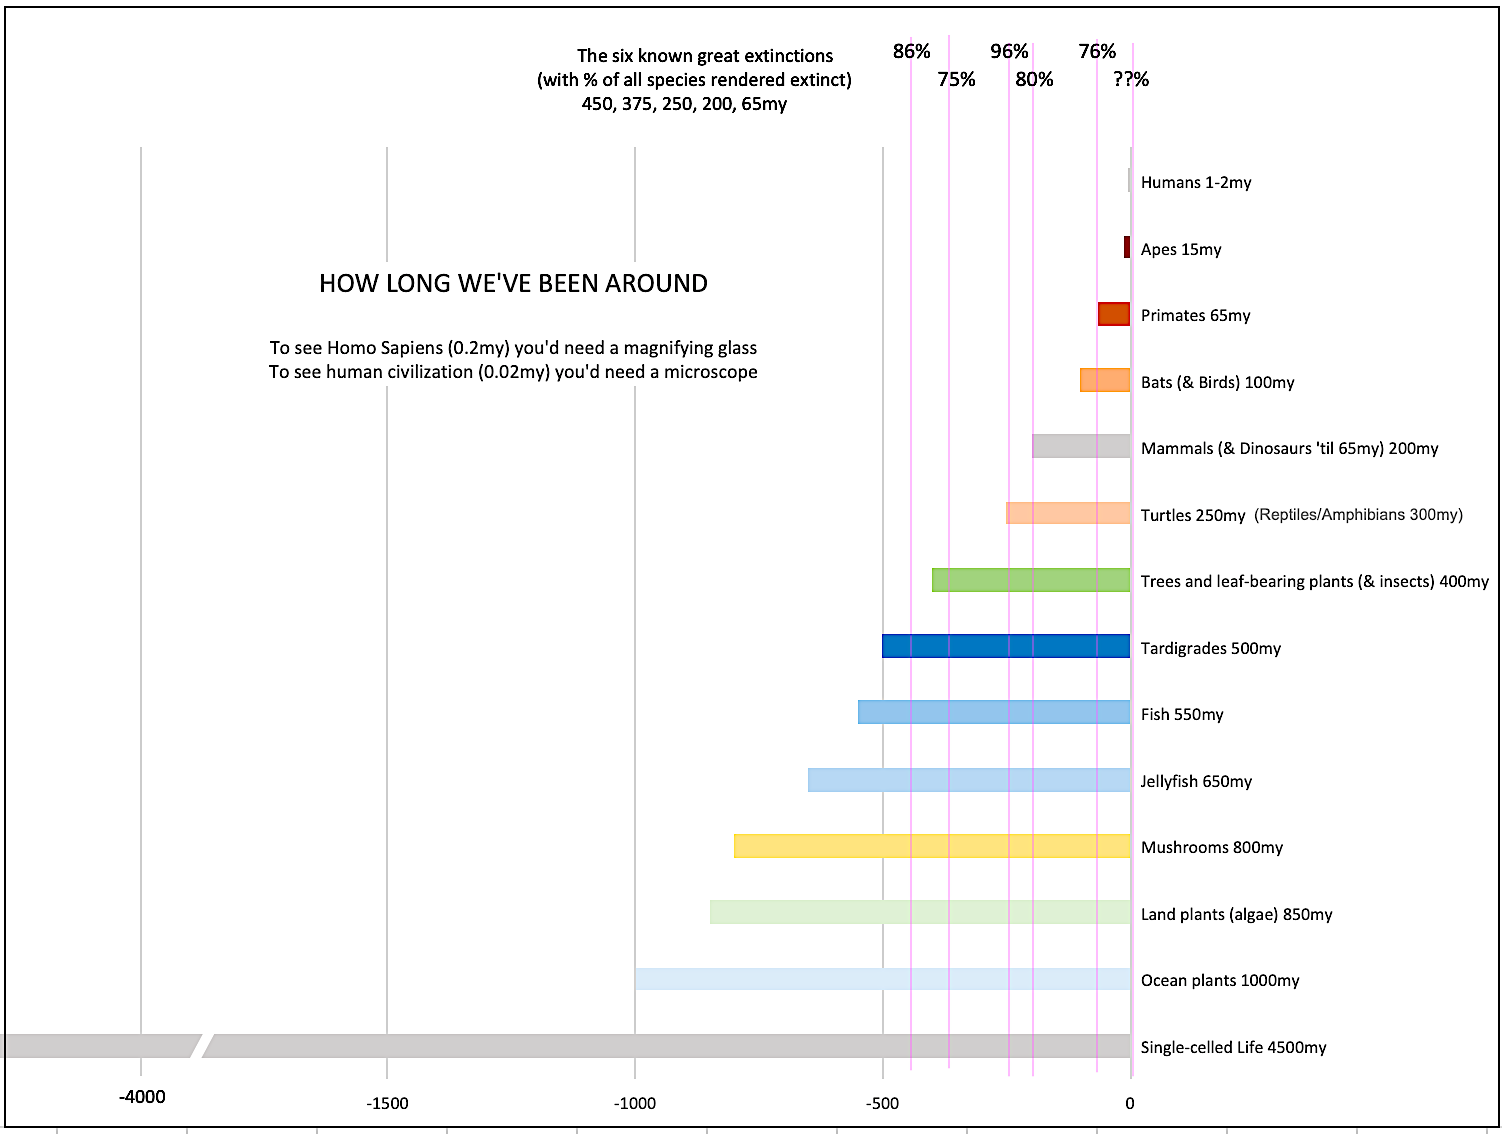
How Long We've Been Around (graphic)
If You Wanted to Sabotage the Elections
Collective Intelligence & Complexity
Ten Things I Wish I'd Learned Earlier
The Problem With Systems
Against Hope (Video)
The Admission of Necessary Ignorance
Several Short Sentences About Jellyfish
Loren Eiseley, in Verse
A Synopsis of 'Finding the Sweet Spot'
Learning from Indigenous Cultures
The Gift Economy
The Job of the Media
The Wal-Mart Dilemma
The Illusion of the Separate Self, and Free Will:
No Free Will, No Freedom
The Other Side of 'No Me'
This Body Takes Me For a Walk
The Only One Who Really Knew Me
No Free Will — Fightin' Words
The Paradox of the Self
A Radical Non-Duality FAQ
What We Think We Know
Bark Bark Bark Bark Bark Bark Bark
Healing From Ourselves
The Entanglement Hypothesis
Nothing Needs to Happen
Nothing to Say About This
What I Wanted to Believe
A Continuous Reassemblage of Meaning
No Choice But to Misbehave
What's Apparently Happening
A Different Kind of Animal
Happy Now?
This Creature
Did Early Humans Have Selves?
Nothing On Offer Here
Even Simpler and More Hopeless Than That
Glimpses
How Our Bodies Sense the World
Fragments
What Happens in Vagus
We Have No Choice
Never Comfortable in the Skin of Self
Letting Go of the Story of Me
All There Is, Is This
A Theory of No Mind
Creative Works:
Mindful Wanderings (Reflections) (Archive)
A Prayer to No One
Frogs' Hollow (Short Story)
We Do What We Do (Poem)
Negative Assertions (Poem)
Reminder (Short Story)
A Canadian Sorry (Satire)
Under No Illusions (Short Story)
The Ever-Stranger (Poem)
The Fortune Teller (Short Story)
Non-Duality Dude (Play)
Your Self: An Owner's Manual (Satire)
All the Things I Thought I Knew (Short Story)
On the Shoulders of Giants (Short Story)
Improv (Poem)
Calling the Cage Freedom (Short Story)
Rune (Poem)
Only This (Poem)
The Other Extinction (Short Story)
Invisible (Poem)
Disruption (Short Story)
A Thought-Less Experiment (Poem)
Speaking Grosbeak (Short Story)
The Only Way There (Short Story)
The Wild Man (Short Story)
Flywheel (Short Story)
The Opposite of Presence (Satire)
How to Make Love Last (Poem)
The Horses' Bodies (Poem)
Enough (Lament)
Distracted (Short Story)
Worse, Still (Poem)
Conjurer (Satire)
A Conversation (Short Story)
Farewell to Albion (Poem)
My Other Sites


What came to mind when I first saw the diagram was… dysfunctional tarot spread. Maybe because you titled it House of Cards.
Solution: cooperativesDon’t fight the rich, ignore them.cooperative housing, banking, energy, food, etc.
I like the graphic. It puts a lot of concepts together in a relatively simple, illustrative way. That said, there is at least one error and probably a couple ways the graph can be improved to better represent the concepts it is trying to convey. First, the error: (6) Tax Cuts should be going from government to “Rich Individuals” not corporations and similarly, (8) corporate subsidies should go from government to corporations, not directly to rich individuals. Then, some suggestions: One flow that isn’t charted is the profits from corporations to rich individuals. Instead the two are overlapped as is if they are one and the same. Certainly it is true that rich individuals own a huge fraction of large corporations, but I think it would be useful to represent this profit flow.Also, as it is currently drawn all the lines are the same thickness, but the relative amounts of capital flow moving along each line vary. It might be helpful to draw the lines with a thickness that represents the amount of $ flowing in that direction. That would aid in showing where the net gain (i.e. wealth accumulation) is going. Another thing is that “Rich taxpayers” is really a subset of “All taxpayers” and “All taxpayers” are not affected by (12) falling wages. Only wage-workers are negatively impacted by falling wages. Is there a way to have an “All Taxpayers group” and then subdivisions within it? Also, about (12) falling wages. While the wages are paid in that direction, the key aspect of them falling is that — to the extent wages really are falling — the money flow is shrinking meaning more of the flow is retained by the corporations. Is there a way to depict that?
Dave, nice use of a graphic to explain your idea, and a good tool to help others catch on. Have you heard of system dynamics? It’s a simulation-based approach that has a diagramming style quite similar to yours, and it offers the benefit of being able to test and demonstrate claims such as you’ve made. See the downloadable models at http://pegasuscom.com/aar/model.html (there’s an archive with models on different topics) and postings such as http://facilitatedsystems.com/weblog/2005/11/more-on-two-types-of-numbers.html and http://facilitatedsystems.com/weblog/2006/02/stocks-flows-and-greenlands-glaciers.html (once I figure out why the graphic isn’t showing up—hopefully in just a few minutes).
Dave, A couple of other machines that transfer wealth: 1) Warped Legal system (think of the War on Drugs, and other highly biased legal structures that transfer wealth to a select group of lawyers, or to the State, or both.)2) Medical duress (think of a highly privatized system that easily bankrupts a middle class family), or perhaps introduces them to an unsustainable cycle of debt.
Good points, everyone. Blyden, yes, you’re right (I cheated a bit to avoid lines crossing over each other). I’m a big fan of system thinking and system dynamics but I haven’t yet found a really good tool for doing the diagrams. Besides, this approach doesn’t work well for especially complex systems, where there are too many variables and the causal connections are too complex to assess.
Excellent post. My brain generally shuts down when I see a complex diagram like that, but the textual explanations were perfectly clear to me.
This is a really clear illustration of how to synthesis the disparate methods of the ongoing class war, but I’m not sure I understand how “cheap imported products” became “overpriced, imported products” a few sentences later. Which is it?