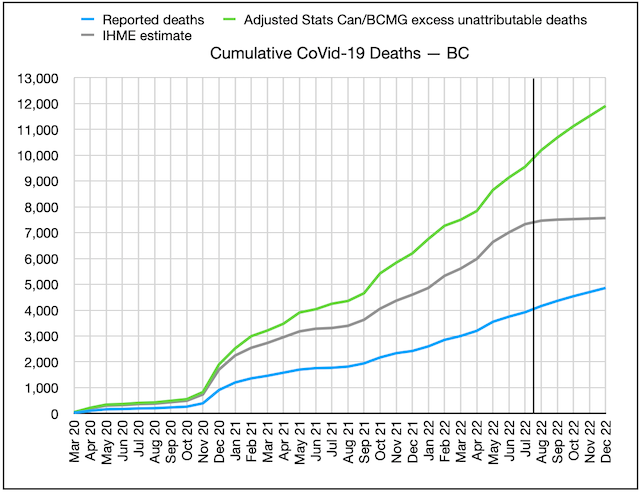
Cumulative CoVid-19 deaths for BC, three sources: BC CDC (blue), BC CoVid-19 Modelling Group (green), U of Washington IHME (grey)
Early in the pandemic, there was some statistical evidence that BC had been slow on the uptake in capturing and reporting CoVid-19 deaths in the province, and had missed 300-400 deaths in the first months of the pandemic. The health officers shrugged it off, and there is of course always some debate about whether the “cause” of a death was CoVid-19, just because the patient happened to have the disease when they died.
Since the provincial health officer, Dr Bonnie Henry, seemed to be providing candid and complete disclosures about the pandemic (she has won several awards, and commendations bordering on adulation from her peers and fans) I was inclined to give her the benefit of the doubt.
I was one of the earliest advocates of using “excess deaths” as a more reliable way of computing the pandemic’s true toll. It can be dicey of course: In the case of BC, the skyrocketing increase of deaths from toxic street drugs has outpaced the reported CoVid-19 death rate, and severely skewed the “excess deaths” number, as did the 2021 “heat dome” that took a minimum of 600 and perhaps double that number of lives, largely among the same demographic dying of CoVid-19.
And there are people who would have died if there’d been no pandemic (auto accident and industrial accident victims in 2020 and 2021 for example were down sharply). And there were people who died because they delayed surgery and other health interventions because they were afraid of getting the disease or because the hospitals were full.
There has been a fair bit of evidence that, on balance, the excess deaths number is probably a much better surrogate for actual CoVid-19 deaths than the reported deaths number, especially in jurisdictions with poor health reporting or which deliberately suppressed CoVid-19 numbers for political reasons. Over a large enough population, any significant deviation from past year’s average total death tolls almost certainly has a reason, and CoVid-19 is the obvious one.
Sure enough, when you look at global excess deaths data, the patterns and numbers, based on each country’s political, economic, and health care system, start to look not only consistent but predictable. These excess death numbers also align much better with seroprevalence and other data on the actual proportion of the country that’s been infected and inoculated.
It’s when you get down to the sub-national level that these data start to get a bit mind-boggling. In Canada, for instance, excess deaths in the three westernmost provinces have been on average twice the number of reported CoVid-19 deaths, while in Québec and some Atlantic provinces excess deaths have been less than reported CoVid-19 numbers. Québec has a very different reporting system, but the other provinces purport to follow consistent reporting standards.
So are the three westernmost provinces radically underreporting actual CoVid-19 deaths, or not, and if they are, how and why? Alberta has an extreme right-wing CoVid-19-denying and -minimizing government, while BC appeared to be letting Dr Henry lay it all out there and call the shots on what to mandate, at least in the early part of the pandemic. Yet the two provinces have very similar discrepancies between excess deaths (even adjusting for the toxic street drug epidemic and the ‘heat dome’) and reported CoVid-19 deaths. So what’s going on here?
Dr Henry continues to say that, while she doesn’t deny the Statistics Canada excess deaths data, she believes the reported numbers are quite accurate, and that there may be other, perfectly valid reasons for the discrepancy.
But a few months ago, BC changed both the frequency (to once a week, with a 10-day lag) and method of computing deaths, and pretty much stopped reporting case data entirely, using ‘surrogates’ in lieu of precise tabulations. They stressed that data before the change was not comparable to data after the changes, so they should not be combined. In other words, if you want to know how many people have actually died of CoVid-19 in BC, you’re pretty much out of luck.
Unless you use “excess deaths”, that is. At the same time the politicians have shrugged off the use of excess deaths as a most likely estimate of CoVid-19 deaths, and basically taken the podium away from health officers, they have failed to provide any useful data to use instead.
The chart for cumulative reported CoVid-19 deaths versus cumulative excess deaths since the pandemic began is shown above.
It suggests 10,000 British Columbians, not 4,000, have perished from CoVid-19 so far, rising at an annual rate of 3,000, unless you assume, as IHME does, that we’ve seen the last wave. That’s 1 in 7 British Columbians over age 80.
So sorry, Dr Henry, but until you actually present some data to show otherwise, I have to think that your estimate of the province’s CoVid-19 deaths is wildly wrong. Eight people per day, not four, are dying of CoVid-19 in BC this month, and this level of understatement has been going on since the pandemic began. How, and why? I think we need some answers from you.
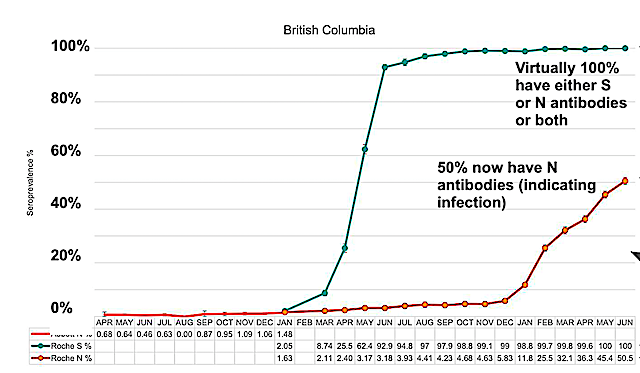
Turning from deaths to cases: Here’s the chart of seroprevalence data showing how the percentage of British Columbians catching the disease is skyrocketing since Omicron emerged:

data from BC COVID-19 Modelling Group and CoVid-29 Immunity Task Force
As of August 13, total reported cases in BC equate to 7% of the population, while seroprevalence studies suggest 56% of the population, 8 times this number, has actually contracted the disease at some point during the pandemic. Current reported daily new cases in the province average about 125, while the seroprevalence data suggests actual new cases in BC are currently running about 13,500 per day.
As this data shows, the BC CDC only catches and reports a tiny percentage of new cases (about 1%, according to most recent estimates). They are now forcing us to use seroprevalence data (mostly from regular blood donors, demographically adjusted) or sewer water prevalence, to figure out how many people are now getting the disease. This data suggests that about 8% of the population, or 400,000 British Columbians are catching the disease or being reinfected each month, and about 2% of the population, or 100,000 British Columbians, are actively infectious today.
In other words, if you are a British Columbian, it is likely that one out of every 50 people you work with, or share a restaurant or bus or train ride with, each day, is actively infectious, and that number is not declining. And more than one out of every 12 of us will be infected, or reinfected, this month. That means your chances of getting it, or getting it again, this month, are, unless you take unusual precautions, one in 12 this month. And probably next month. And the month after that.
““`
The good news, if there is any, is that estimates of the proportion of the infected population (which will soon be just about everyone) getting significant ‘Long CoVid’ symptoms have come down from as high as 1-in-3 to about 1-in-8-or-10, and for those previously fully vaccinated and boostered, the risk is significantly lower again (as is the risk of hospitalization or death when you do get the disease).
That’s still a staggering number of Long Covid patients, one that threatens to wreak long-term havoc on our already-teetering health care system, and on participation in our labour force.
The data for most other provinces and states in North America are comparable to the above BC data — it’s just that, until we took a closer look, we thought we in BC had been doing so much better than everyone else.
So, of course, with that high risk of infection, we should be N95 masking in all indoor locations outside the home, and whenever we’re in a crowded location. And testing and isolating and letting people know when learn we’ve been exposed to someone with the disease until we again test negative or have no fever or symptoms remaining. We’re still only at half-time in this pandemic.
And with the still-unacceptably-high risk of death (at least for those over 60, or obese, or immunocompromised) and of Long Covid, we should be taking extra precautions, avoiding crowds and risky environments (like restaurants and parties) where there is no testing and low mask use. And, of course, getting all our vaccinations and boosters.
As a recent report in the Tyee put it, quoting the above new research: “If the public knew just how much BA5 we have at the moment, we’d see a lot more masking than we currently have.”
So why doesn’t the public know this? And why is our province apparently understating its CoVid-19 death toll by more than half? And what are we going to do when we get yet another surge this coming winter?
I don’t have any answers. And I can’t seem to find anyone that has.


Thanks Dave. I am flummoxed as to why the data set for COVID isn’t open. Or at the very least why the advice isn’t “assume it’s worse than you think” and take the advice in your post.
Vaccine mandates (and other Covid-19 theatrical measures) have harmed BC residents. Excess deaths are the result of these policies. Public health’s charter (allegedly) is to preserve and improve public health, yet in BC, the opposite outcome was achieved. You are seeing excess deaths in the graph because Covid vaccines were and are killing people. These deaths are under-reported because accuracy in reporting would (further) implicate those who mandated these crippling and deadly injections.
The Canadian Society for the Advancement of Science in Public Policy (CSASPP) is suing Bonnie Henry. You have a chance to help, Dave.
You used to call yourself a knowledge professional, yet you appear to be clueless when the evidence is staring you right in the face. Its inconvenient. But then, so is reality.
Withheld: The excess deaths substantially predate the introduction of the vaccines. The evidence simply doesn’t support your hypothesis.